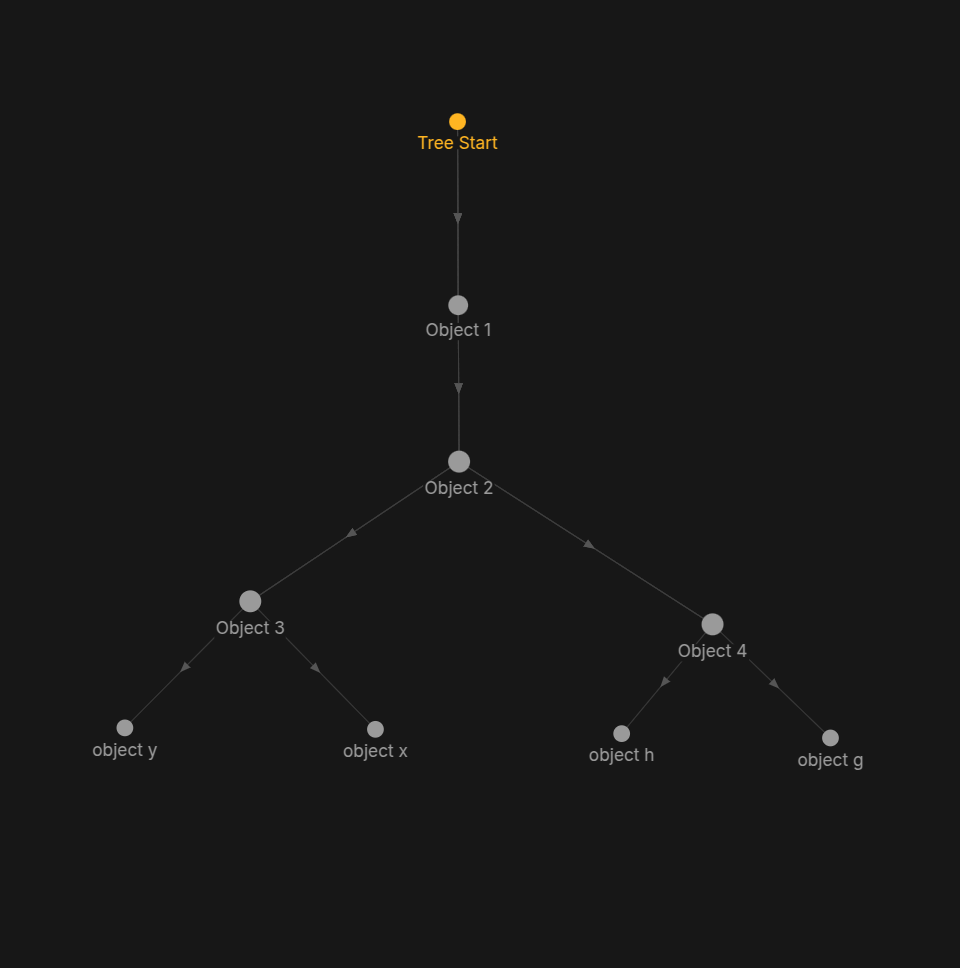
Enhance Graph View with a Tree Layout

WHAT DO I RECOMMEND?

Add the ability to select a tree layout as also mentioned in this request.

  • **Tree Layout: Vertical, downward-branching tree

A simple tree layout would improve Anytype as a whole significantly to visualize and organise better.

HOW COULD IT BE DONE?

  1. Graph View Settings:
  • Add a dropdown menu in the Graph View settings to select layout types: Mindmap, Tree Layout / Org Chart.
  1. Image/ Object Icon Settings:
  • Increase image sizes, as current icons are too small, to improve visibility. Maybe add even some extra like object descriptions.

REAL WORLD USE CASES

  1. Better Project Management

  2. Improved Photo/Files/Object Organization

How do you suppose that this could work?
Anytype has no tree structure. And this is btw. a main advantage!

In a tree structure, an Object has only one parent above itself.
But in Anytype, each Object, each Collection, each Query … can have unlimited many “parents” above itself and off course also unlimited Objects below itself.

Links can even built rings in Anytype.
It’s simply not possible (as far as I can think) to press Anytype’s structure into a tree diagram.

A simple example:
Imagine you have a space with only five Objects (to get a clear imagination).
Now link each Object with each other!

Because our links are (unfortunately!) only one-directional, it would lead to 20 links!
Try to draw the tree diagram and post it, I want to see how you solve this!
– Good luck! :wink:

P.S.:
In your linked thread, the Layout Style “Organic” is the way how Anytype works (look at the ring structure as part of the “organic” example - clearly not possible in a tree!).
And this “organic” layout is the way how our Graph displays the things.

There is always a first object in Anytype. Those objects will always be on top. This is how the trees start. The sidebar is already working like this. Like a simple folder structure. And the graph view already works this way too of course. Sure if objects are in multiple objects linked things get messy as we already can see in the normal graph view at the moment. I suggest there should be an option to active those relations only when needed. But giving us different layout options for the graph view would be huge. Its already there. It just needs to be displayed differently.

Would a canvas work for your case?

Nope. Why should there always be a “first Object”, that’s on top of the tree?
Think on a Space with even less then five Objects. A space with only three Objects.
Link them together like a triangle (the smallest ring structure btw.):
A links to B
B links to C
C links to A

Don’t tell me, there is a clear “top of the tree”.
If you still think so, then add a fourth Object and link them together like a square.
Still not clear? Then draw also the diagonals into the square and link the Objects in this way: each corner links to the other three Objects.

Again: such a structure is not a tree.
A tree has in principle always only one parent Object. Never two or more.

I understand that you have the wish for diferent kinds of visual representation then the “messy” looking graph.
But if you explicit ask for a “tree” representation, then you’re wrong – it’s simply not possible to press Anytype’s much more rich and complicated structure into a tree layout.

That’s not a valid example. The sidebar shows never something like a full tree, because it can’t do that.
It shows only a tiny fragment. A Collection has some Objects in it. Each of these Objects are represented in the widget as if they would have exact one parent (the Collection).
But each Object in a shown Collection could at the same time also be in some other Collections and additionally be linked with each other.
The widget in the side menu does not and can not represent such things.
The widget shows only what belongs into exact one Collection, it spare out the fact that the Object in that Collection could at the same time also have other parent Collections (and/or parent Objects). Therefore: this representation spares out all these complicated criss-cross connections and multi-parent dependencies.

As already written in my last post:
Anytype’s structure is in principle an “organic” layout, as seen in your linked thread.
– Try it for yourself to draw the “organic” structure from the image in your linked thred as a “tree” (there each Object has only exact ONE parent, never more then one!).
It’s simply impossible.

.

You could as for another representation, where the graph spares out the Links between Objects and shows only The links from Collections to their child Objects.
In the result, it would look less messy, because there are no longer all these ring-like parts in the Graph.
But even then: An Object can still have more then one parent aka Collection. Therefore it’s still not a simple tree and still looks more messy then a tree.

To give you an example for that:
Draw three Collections on a paper and three Objects.
Then let each Object be in each of these three Collections.
No matter what you try, it will never be (nor look like) a tree.

Really do it: try to draw my examples on a paper!
It should become absolutely clear then, that the result has nothing to do with a tree structure!
And then imagine even more complex structures then the given examples, with more then only 3-5 Objects and with links from and to everything.
– You can’t ignore this, it is definitely not a tree and will never (can’t never) look like a tree – it is a much richer and much more complicated “organic” structure.
I made an example how it could be implemented.

The first object could be always identified by simply selecting an object in the graph view or by the creation date for example and then the tree goes from there. Everything that starts linking again backwards or to a completely different tree could be connected via a simple knot line that goes up the tree to show the relations. Those relations could be toggled on and off. Here is an example:

The normal graph view as tree layout with all relations toggled on.

The normal graph view as tree layout with relations toggled off.

This also works if some objects were linked to a completely different tree. This is basically like your suggestions where links between objects are spared out and it only shows the child objects.

I personally dont need to see relations. That is what the graph view is for. I would be just very happy if it was possible to get any type of tree layout to work with. Do you think this is something that would make sense to implement?

This makes no sense for me.
And why do you speak about Relations On/Off?
– To make things simple, let’s assume the structure in your first image uses only Links (no Relations).
Try to draw it as a tree! – It’s impossible!

Why is it impossible?
– Because the structure in the first image has rings, as well as Objects with more then one “parent” (Objects above itself).
Both is impossible in a tree structure.

Your second image is not the correct representation, because you have arbitrarily omitted connections so that there are no more rings and also no more Objects with more then one parent Object.

But the whole discussion becomes ridiculous – what you stubbornly want is simply not possible in principle!
You can’t do anything against it! And you will not find a way that makes it possible.
Nor Albert Einstein, nor Steven Hawkings could do that.
Not even the aliens have a technology that can display multi-parent Objects in a way that there is only one parent (and so on).

Simply give up the term “tree”, that makes it easier.
What you truly want is not explicit a “tree” representation. What you really want is a somehow more well-organized representation.

Our data are organized in an “organic” structure. It will not be easy, but it may be possible, to find a “nicer” representation then our actual Graph.
But under no circumstances could a tree ever be a possible candidate. “Tree” is simply not suitable to represent a data structure that is more complex and more rich then a tree diagram.

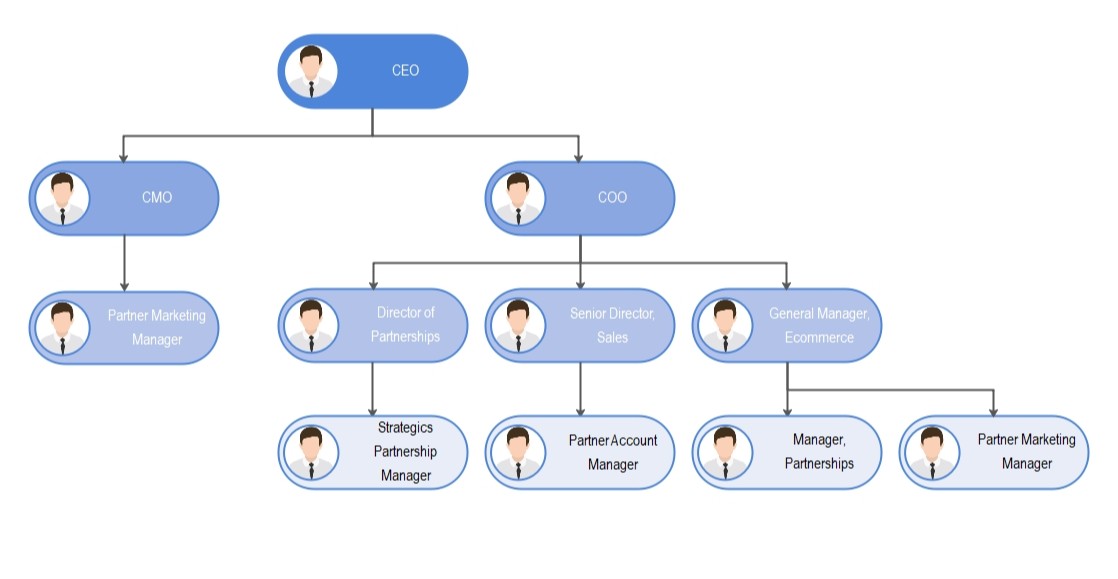
I dont need to draw it. I just did without any tool in Anytype itself. I literally made you the original graph view as it is as a tree layout without doing anything but putting everything in place how it could look like. On the second image I turned of the links to make it even look like a real tree. It literally is already there. If the graph view could save the changes when rearranging things the problem would be solved already. Then i put everything as tree structure or org chart as in the pictures and done. Every time I open the graph view I have my tree structure. And you actually could make things look like on the first image in the post with nice view only vertical and horizontal lines. Objects that are linked more than once will be displayed as organic lines (first picture last comment) i don’t know why this is so hard to understand i literally just made it how it is supposed to look like. Its the original graph view without any changes as tree view despite being organic at the same time.

This here would solve the problem and allow us to make a tree view or org chart. Of course official layouts would be better instead of rearranging everything by itself.

And here is grok answering (exactly as I had in mind, tried to explain and even showed with images)

Comment on Tree View Feasibility in Anytype

It’s technically feasible to display Anytype’s graph as multiple tree views/org charts, with multiply-linked objects shown as standalone nodes connected by organic lines. How: Use a graph database to filter primary relations into hierarchical trees (e.g., Project → Tasks), exclude multiply-linked objects from trees, and draw curved lines for their connections using libraries like D3.js. Algorithms like DFS ensure valid tree structures, while force-directed layouts handle organic lines. Why it makes sense: The current graph view can be cluttered and hard to read, as noted by users. Tree views offer clear hierarchies for primary relations, while organic lines preserve networked connections, improving readability and usability for structured workflows like project management. This aligns with Anytype’s customizable, object-based system and could be an optional view mode.

If that makes more sense to you..

I believe this topic is related as this older request:

Side note:
As I previously mentioned, I believe tree graph is possible if we implement relation with logic assignment.

Yeah, of course would this be possible.
But this is no longer “a” tree.
It is then, what Grok said:
“multiple tree views/org charts, with multiply-linked objects shown as standalone nodes connected by organic lines.”

I repeat it:

  1. MULTIPLE trees.
  2. Connected by ORGANIC lines.
    – This is not “a” tree. This is a modified version of an organic representation.

Grok’s suggestion, to use curved lines, makes sense, but it doesn’t change that we still have an organic structure, not a tree structure.

My words are still valid and Grok’s answer didn’t change anything: it is NOT possible to display an organic structure as a tree.

But if you are happy with a lot of “trees” that are somehow organic connected by multiply-Links to each other, then your request should ask for that.
This is what I’ve meant in my last post: what you truly want is not a tree representation. What you really want is a somehow more well-organized representation – another form to represent a structure that is basically still an organic structure.

For example, you cold ask for the feature, that Objects, that belong to a Collection, are always positioned below the Collection, never above or beside them. And this maybe in a chessboard-like grid.
This sounds plausible on the first look, but in practice it wouldn’t be as simple as is sounds on the first glance.
Why?
Because:

  1. Some Objects belong to multiple Collections that can appear in different vertical positions.
  2. Some Objects could have outgoing Links to Collections that then belong below them.
  3. Closed loops are still possible and it’s hard to deal with that.

There are some creative ways to deal with such things, but the result will never be a normal tree.

For a “tree” representation to be possible, the objects must be available in a tree-like structure. And this is normally NOT the case in Anytype, its data are available in a richer “organic” structure.

You can argue again and again, but it doesn’t change the fact.

I always had multiple trees in mind of course when converting the graph view into a tree layout. A single tree chart wouldn’t work of course. I should have explained that better I mentioned “trees” only once here.

“this is how the trees start”

That is basically what im asking for. Displaying the graph view as multiple trees preferably with a nice layout only horizontal and vertical lines, and for all the links (objects that are linked multiple times and relations) use organic lines that you can then toggle on and off.

But of course making the graph you actually save your changes when rearranging objects would solve this completely for me.

OK, now we have (finally) reached a consensus.
Although there is still the problem, that our organic structure has no “most top” element.
– It can have such an element (depending from the user’s way to organize things), but in many (if not most) cases there is simply not such a thing like a top most element.
And if I thing of my own data structure, it has changed a lot over time. The first weeks, I’ve used a startpage. That was clearly the top most element of the whole structure. But over time, it has changed a lot. The startpage has become a meaningless fragment of old days, I could delete it, it is no longer needed. Instead, after trying other attempts, I now have an organic net of Collections, bot none of them is top most.

And yes, it would be wonderful if the Graph could save the positions!
Unfortunately I foresee a lot problems with such a feature. But secretly I wish it becomes implemented some day.
Why do I foresee problems?
Because:

  1. The user could delete some Collections.
  2. The user could duplicate some other Collections.
  3. The user could link a big bunch of Objects that are in Collection_1, also to Collection_2.
  4. And so on, etc., etc.
    What on earth is the Graph supposed to show, if the user opens it, after performing als described actions?

Such actions are no problem in a dynamical arrangement.
But with saved positions, it can result in a lot chaos that’s nearly impossible to entangle manually.

It’s really not easy to find another representation that works in the real world, with a big and complex structure.
I share your pain! I often think: “Couldn’t the Graph do this & that better if …”
But if I think long enough, there is never a way in sight that would truly work.
Sometimes there is the illusion that there is a genius new way in sight. But after thinking a second or third time, I begin to see (nearly) unsolvable problems.

What I hope for is that “Tag as Object” finally comes. And that the Graph then gives us the opportunity to group Objects around Tags.
– Although I fear that in reality, it wouldn’t help as expected, because most of my Objects has many Tags. So the result may be nearly the same as before, but Objects are connected then to a lot of Tags instead of to a lot of Collections.

Btw.: One year ago, I’ve requested this:

The special idea is, that it combines some major fix points with floating Objects:
The user would be able to “nail” (or “pin”) the positions of Collections (and only Collections!), while the Objects still float as we know it from our actual Graph.

In the result, the Graph has always roughly the same structure that the user can influence how he likes it.
But the positions of the Objects are automatically given in a dynamic way.

This frees the user from the need to position each single Object, while the rough structure always remains.

I believe this would already give a much better overview, while the dynamic part (the positions of the particular Objects) spares the user a lot work and trouble.
It doesn’t matter if he adds or deletes Objects etc. – the dynamic positioning does the job automatically with nearly no influence to the structure as a whole.

What do you think about this concept?

Perhaps we are not just talking about tree/hierarchy in graph, but also a separate on-demand graph feature and/or graph with advanced feature. On demand graph can allow display of only relevant or requested nodes.

  • Depending on the objects retrieval mechanism:
    – Object inclusion list which resembles a graph for collection, or Whiteboards / canvas
    – Object exclusion list which is also Obsidian’s mechanism for both global and local graph
  • Different node positioning methods serve different note-taking purpose
    – Manual/organic positioning, which is also logic behind Ability to Resize a Graph Node and whiteboard, is the best for brainstorming.
    – Automatic / Inferred positioning is great for pattern observation, and would work well with a larger amount of objects. One thing that needs to be resolved with using inferred position for tree/hierarchy is what do we do with conflicts of connection logic. For example, if Object A is Core of Object B, but Object B is also Core of Object A, how do we expect graph to display both on top of another? Local graph or more accurately primary object logic could prioritise this connection display.

All of these mechanisms would work well with my different note-taking needs, as static and dynamic connections exist with different contexts.

Another related topic: Object/attribute collection - use hierarchies and semantic versioning

I personally would prefer to pin every objects in the graph view as it is now above anything else. This would allow each user to create their own custom view, chart, or diagram to work with. If that’s too hard to do, I’m okay with simpler options too of course. Any new feature is a win. Right now, the graph view already lets us pin objects it just needs to save those changes so everyone can set it up how they want. Every objects you don’t pin will keep being dynamic too. I think this would be an easy change (like doesn’t need to much resources to implement from a technical perspective) with a maximal impact. Just don’t reset the view.

Think twice.
Let’s assume, you have spent the tremendous work to position 3000 Objects by hand. Finally is everything perfect.
But one day you come up with the idea, to transfer 200 Objects from one Collection to another. :-/
Or with the idea, to duplicate some Collections.
Or you create 50 new Objects. Etc. etc.

There is no Space for that in the Graph, because everyfing was fine-tuned on the exact right spot.
Now you need to move many hundred Objects to free some Space here and there and there … on the right places, to store the new Objects.

My suggestion, to let Anytype rearrange the Objects automatically, while the user has control over the Collection’s positions, would solve this problem.

I see. If Anytype handles rearranging the objects automatically I would definitely want to be able to select layouts from an option menu, like a one click solutions to represent a collection lets say with all related object in a desired format (not just organically letting everything float). Having just the collections fixed somewhere is nice but having all other objects being organically handled like it is now isn’t something I had in mind. I would rather rearrange all objects again if needed to achieve my desired layout. Like I said before if the graph view would save the changes, letting us fixate the positions of every object, collection, type etc. everyone can create their own custom graph view. If someone adds or duplicate objects, the positions would remain. Of course this would result in long connections all over the screen you have then to work through to make everything looking nice again but its worth it and would allow us to keep a consistent custom view of our graph view. But having the option to only fixate collections as a start would of course help immense too to get at least somewhat of control over the graph view. My key point is to have the power to decide myself where objects are positioned on the graph which would include all of them like it is now.

Although you insist that you would prefer it: I’m convinced that you wouldn’t like it if it would really becomes implemented.
I foresee that you would give up to rearrange all the Objects – if not after one day, then after two or three days.

I’m experienced in PCB-design. To untangle a circuit board layout is very similar to rearranging our Graph. Before routing the traces, the work begins with the arrangement of the parts that are already connected by “rubber lines” (similar to our graph). It’s already a lot work and a lot of head scratching to find a good arrangement.
I know very well how much work it is to shove some additional parts between other parts that was already well arranged.

There are tools that free the user from this immensely time consuming task. “Auto-arrangement” is the magic word.
And this was my suggestion in my linked FR: The user can manually arrange some strategical important parts (in our case: Collections), but all the less important Objects rearrange automatically.
If that’s the case, then it’s no longer a problem to add some dozen additional Objects, etc. – they appear automatically on “good positions” and the automatism shoves already arranged Object to the side if necessary.

What you ask for, is to give up the help of such intelligent modern automatisms. It’s a big step back in the development.
And I have the clear impression that you simply lack such experiences with untangling complex nets; that’s why you don’t see the consequences.
You ask for something that you wouldn’t like if it became implemented – I foresee that, based on my long years of experience with entangling, modify and expand complex net-structures.
That’s why I wrote: “Think twice”.