I’m trying to create a relation - let’s call them simply “Progress” - so I can assign my “progress” to each of the projects I’m doing.
Problem is when trying to create a relation I can either use the tag kind of relation, but that does not let me use icons/svg’s - just plain text (and some keyboard emoji) + plus for each progress number (from 0 to 100%) I would have to manually type every number down in order to create a tag for a progress number.
It’s similar when I try to use the status or other relation, where it’s even worse, because you can not choose from a (dropdown) list.
Worst of all its just not asthetically pleasing as I need a visual identification and not something that can only be recognized as a very small mini thumbnail in a list of projects.
To make it short:
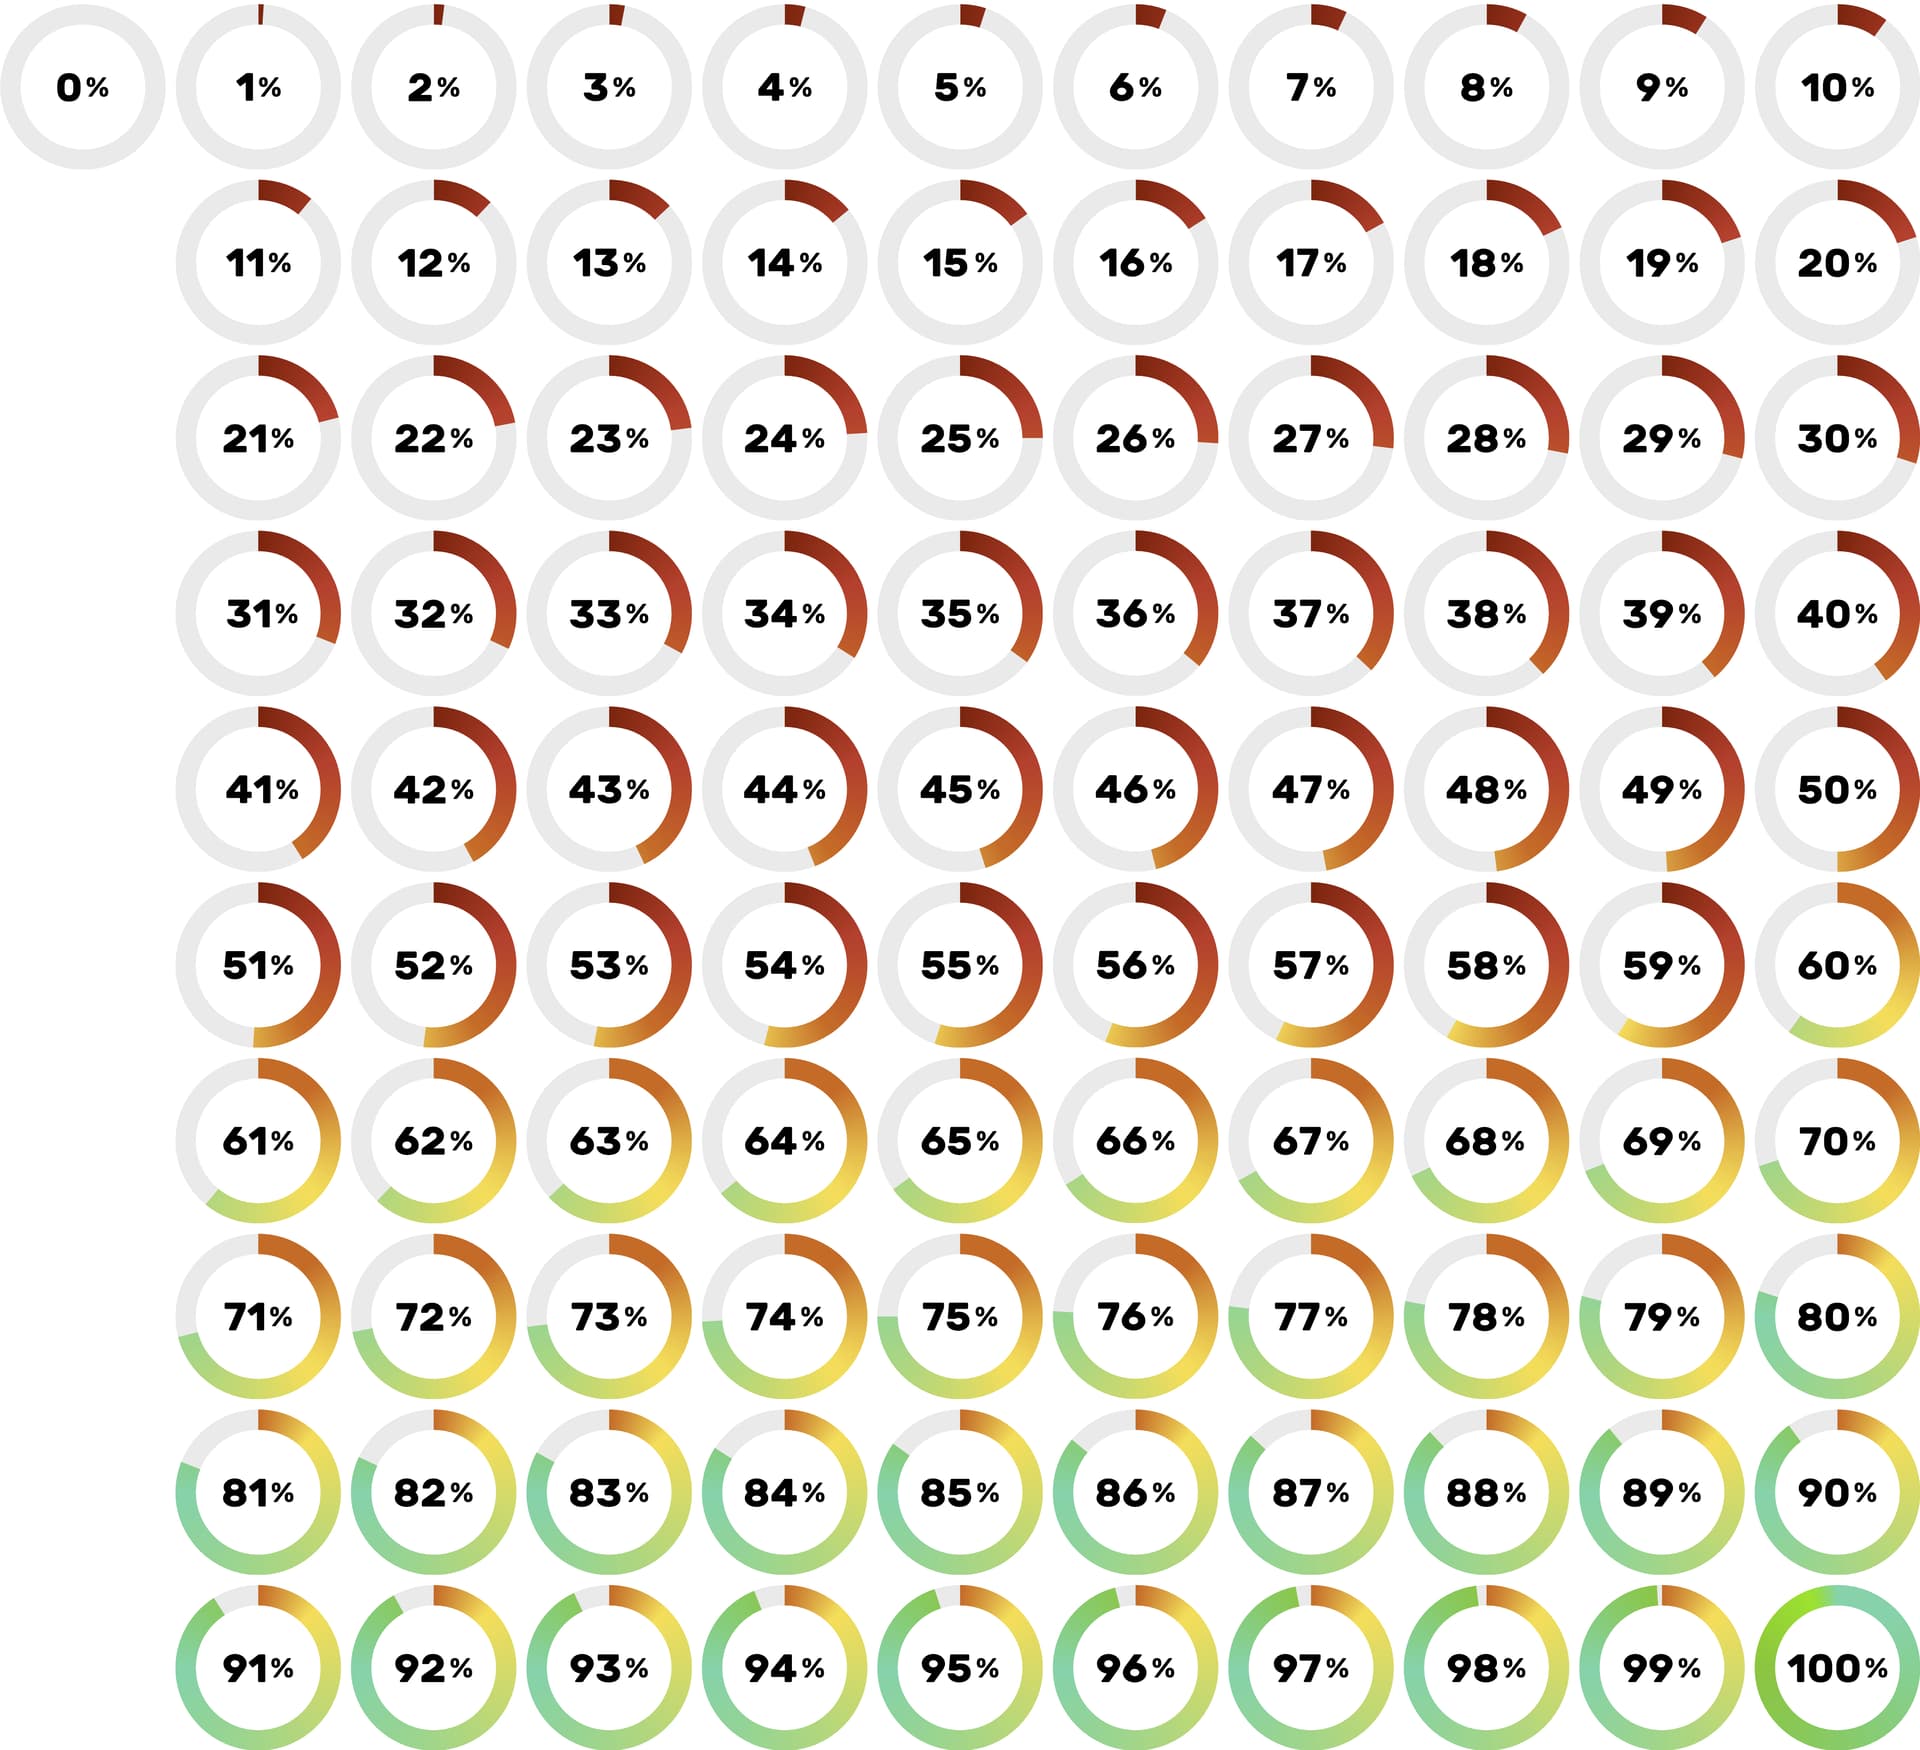
I created svg’s of a pie chart for each number (0 to 100 %).
What’s the approach to easily use these svg’s as a single relation (sort of a dropdown list) that I can give to each my projects/tasks?!
It is not yet possible to use svg as tags. (You can create a relation with image objects selected, but it’s too small for pie charts) The current workaround is to be creative with symbols or emojis to make it look like progress bars. Mine is set as status options, so I can only select one ‘bar’, indicating current progress. @Hexara made a good post about it that you can copy-paste. It was narrowed down to 11 relations:
As I already wrote, I know this “workaround” already - as I described that it would involve “just plain text and some keyboard emoji” only and you would have to create 100 tags with these symbols. It’s really cumbersome and not visually pleasing. Besides: It would look like a horizontal progress bar, not a pie chart. And If you use this workaround it looks not structured if you have a list or collection usingn this method.
I just think if Anytype would give us the option to create a dropdown-list as a relation - where users can use their own icons/svg’s it would perfectly harmonize with the idea of the “everything app” - it makes sense, since you can already design (almost anything) that people create within anytype.
An alternative method is adding all the pictures (renaming image with % as their names) into Anytype, then create an object-supported relation, limit the object type to image, then you should be able to search for these image more easily.
It would display the file name as well, but if the column width in a set/collection is just fit, you should be able to display the picture only.
If advance filter is implemented to object-supported relation, it would be even quicker to reach for the options you need, by further limiting the available options to files with % names only.