Poll: Is graph view part of you workflow? If so, how do you use it?

I know everyone thinks differently and finds different things helpful, but I have really hard time understanding how graph view can be used and what it brings to the table, so please help me understand :sweat_smile:

Is graph view part of you workflow?
If it is, please explain how you use it below.

  • Yes (describe below)
  • No
0 voters

This is a silly use but it’s kind of practical at the same time. Outside of using it in fictional writing, I will watch a lot of movies or shows with friends and I track what movies I’ve watched and more specifically who I have watched them with. Anything to help visualize those connections and be able to move through them.

Graph view as it is right now is a stub feature. In order for it be useful it needs a lot of bread and butter stuff added to it. Filtering by types, filtering by relations, styling according to various criteria, options for controlling layout, pattern matching, named view saving and restoring, and on and on and on.

When you add those things, graph view gets a ton of possible use cases. It can help you spot inconsistencies in your structure, it can help you visualize how closely connected things are, it can help you generate ideas, it can help you create diagrams.

There are more sophisticated features that would increase the value further. With a log of changes, Anytype could show your graph evolve over time, giving you insights into your process. Plus real graph analysis tools could make Gephi unneeded in many instances, and open the doorway to non-academics and non-professionals.

But right now, the graph view is almost completely useless. Its main purposes are to look pretty so our imaginations are fired up, and (educated guess) for the development team to get the force graph library up and running nice and stable within the application.

This subject comes up frequently in the Community, and you can find similar discussions scattered throughout. Here’s one for example: Some thoughts on the new design of the Graph View

Since there are a few bugs with global search e.g. bug with task in search. Graph view is what you can rely on to find an objects ← This is the largest part of my current workflow.

Other than that, I am still eagerly waiting for local graph view for a smooth workflow to trace nearby objects or clutter of objects.

Generally speaking, graph view is good for observation of patterns, and incoming and outgoing behaviours. Distanced individual nodes help linking back to the core knowledge.

The following discussion also has rich contents about graph view.

In Anytype, the graph is created as a core element (user element at the bottom centre, start element) and I think it should be easy to use. I also realise that everyone has different expectations and purposes for using Anytype. Therefore, this is just a suggestion for a possibility.
For a clear arrangement of objects, you can keep your e.g. four burners or most important areas as favourites in the sidebar and not link them to each other. The areas should also be linked in levels that are not too deep. In the end, there are sets or collections.
The advantage is an appealing view with clear groupings of a slowly growing sky with formations of zodiac signs, which in this form also provides new insights. It is then not a ball of wool or a cloud with overlapping links.
From my experience with Obsidian (incl. Dataview) and the Dailies First method, the existing graph is an unusable chaos. Certainly, tendencies can be recognised through condensations.

I use the visualization chart as if it were a mind map. It works for me as if it were a browser. For me, the visualization chart is like a summary of a book, the index of my safe and all my assets inside. He is the backbone of my knowledge.

However, as it is at the moment I miss some features.

One feature that I miss in the graph view is that I can manually change this graph and it persists in the location where I left the node in question.

Another feature that I miss in the visualization graph is that I can mark the size of the node, make it big or small, it has several different sizes as if you were adjusting the size of a True Type font, for example.

I also miss that the title is displayed entirely on the screen and not just a piece, this title could be broken into one line, two lines, three lines, etc…

To tell the truth, Anytype’s bottom menu is the most perfect I’ve ever seen. It’s basically:

  • Forward/back
  • New document (+)
  • Index (Graphic Viewer)
  • Search
  • Open new Vault

Any attempt to change this menu layout will be a disaster as it is the “final stage”!

Now, the most useless thing I think it has is the “Flow” tab. This resource for me is definitely disposable as it has no function. In fact, it is a bandage!, in an attempt to correct the flaws in the graphical mode.

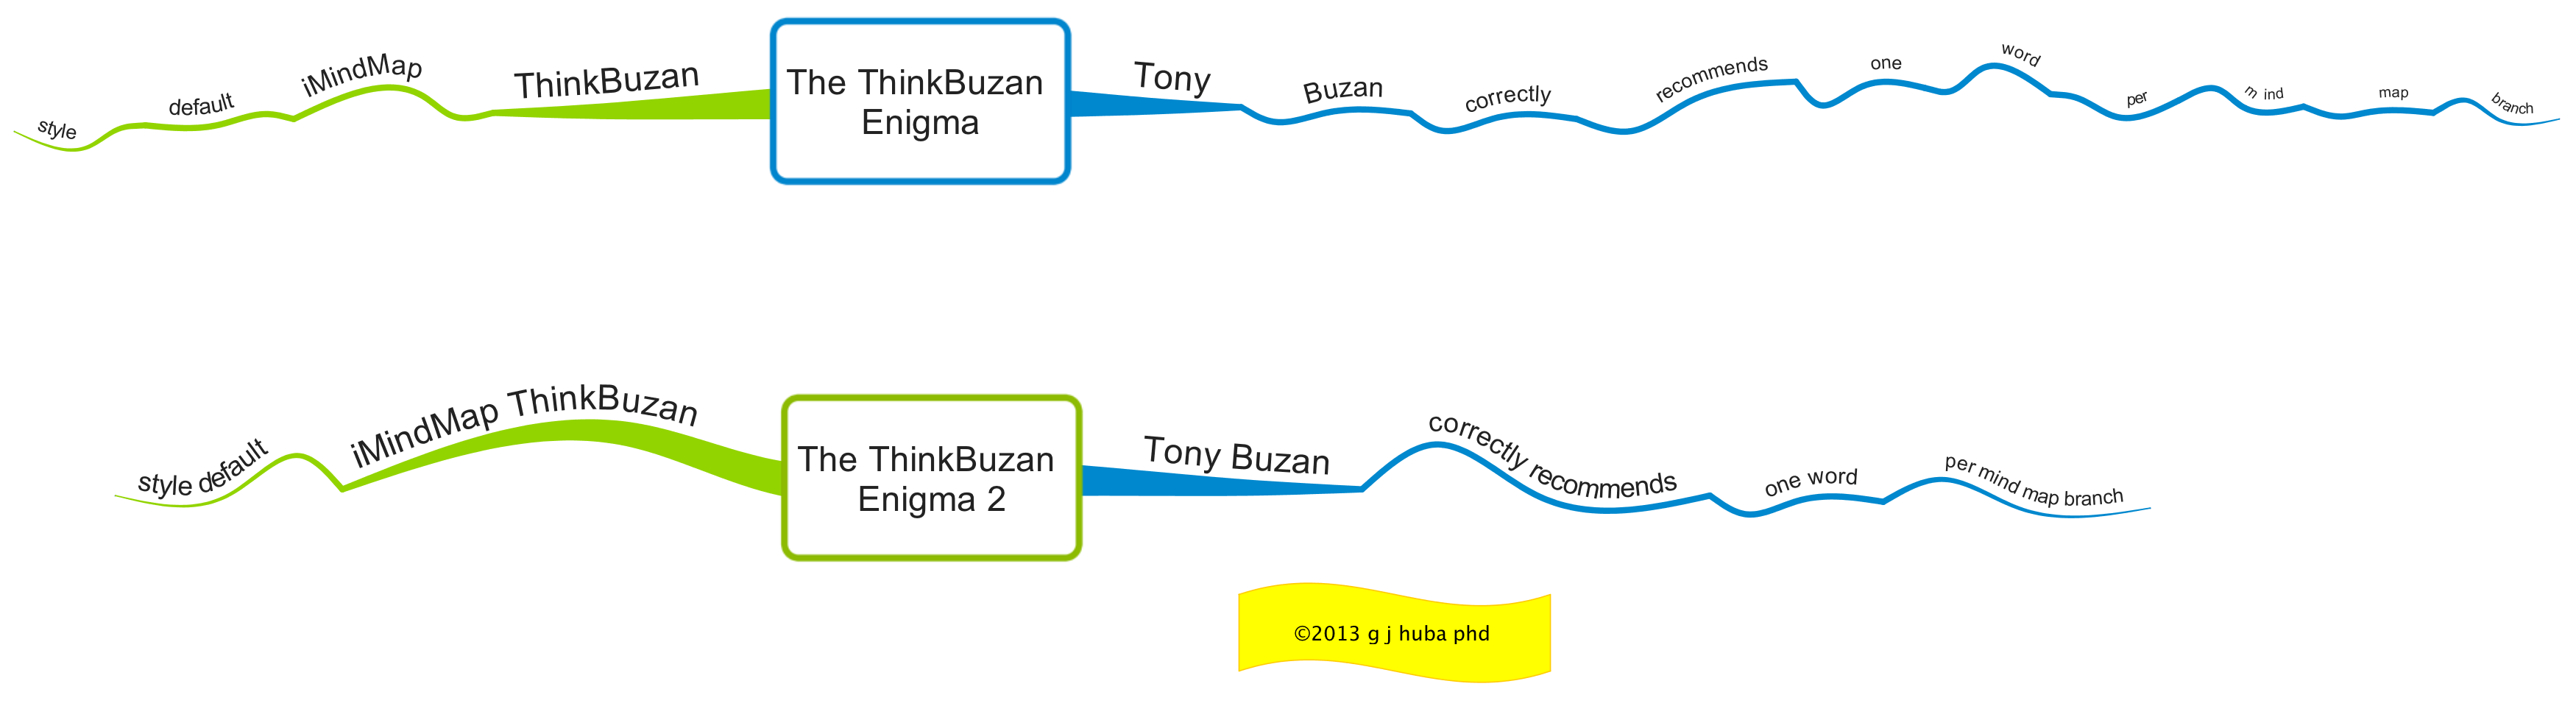
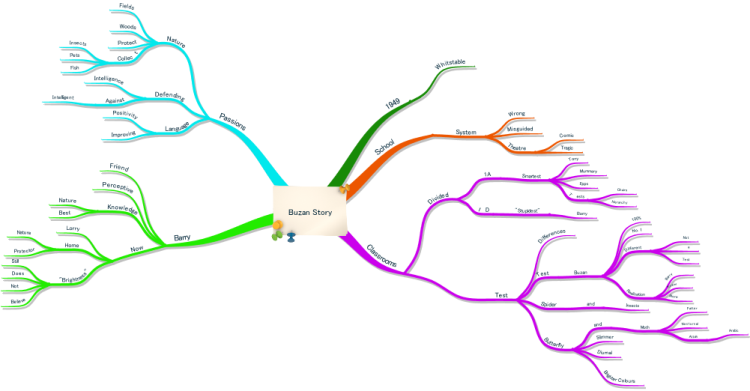
There in that place I would discontinue the form it is and replace it with an “infinite canvas” (.jsoncanvas) where there would be a “mental map” in the Buzan style (as it has thick branches). Look:

Each branch of this would be a file in my vault and the connection scheme would work just like the graphical mode. When I clicked on the specific branch it would become a leaf, I mean, a box just like it is today in the flow tab. Remember: the flow tab has three levels; the middle level has a large box and the side level has a small box. When you click on the branch you want, it becomes, or a large box rises above the branch (the same as it is now in the stream).

The small box would look like this: if I wanted to highlight a branch like this, as the content would be important to be seen immediately, I would mark the branch in question and it would be converted into a box (sheet). Like this:

But in Anytype, the box would be as it is now in “flow mode”.

Once there was, this automatically generated “mind map” would be different from the “Gragh View” because of the following:

But in Anytype, the box would be as it is now in “flow mode”.

Once there was, this automatically generated “mind map” would be different from the “Gragh View” because of the following:

  • List item

The possibility of adding:

And it would do the same process as the “Flow”, because in this map, the central file would be the one selected in “graphic mode”, and the branches would be all the links connected to it.

Well that’s what I think about “Graphic Mode”.

Addendum:
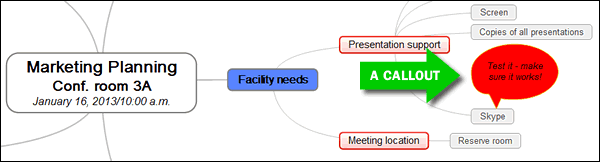
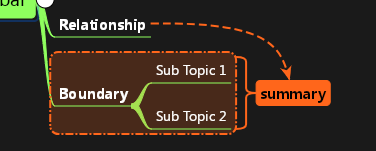
The “Callouts, Summary, Relationship, Bondary” functions are added manually and are exclusive to this mode. As if it were a kind of Metadata.

I use tags a lot so until tags are included in the graph, I don’t really use it. I probably would do in the future though.

I write a series of comedy books so my Anytype is full of joke & episode ideas. I try to add at least 4 tags to each idea and I’m hoping that when the tags are improved and included in the graph, I can use it to find related jokes when I’m writing an episode

My dream scenario for the graph view would be if it was almost like a mind map, where it would display more information if you want (e.g. a preview of the content), and where I could edit the content within the graph. Or at least some kind of side panel that showed an editable version of the object selected

I would also like proper filtering and saveable views (like you can with the table view), so I could, for example, show all the ideas associated with a particular episode, and then I could not show / or show ideas with certain tags or if a checkbox is checked, or ideas I had between certain dates etc.

I would also like to use my mouse to draw a rectangle or a circle to select a bunch of objects in the graph, and then convert the selected items into a collection so I could view it in a table etc. Or even, leave the rectangle / circle there and then create multiple circles / rectangles which I could assign certain tags or relations to (almost like a kanban board but freestyle). For example, let’s say I have hundreds of ideas and I’m looking for ideas to use for an episode, I could draw a big circle or rectangle with my mouse, then any object I move to this circle with drag and drop would be tagged as that episode.

With this circle / rectangle idea, you could do it like a big venn diagram. Where the circles can overlap so objects that are in both would get the tags from both.

I would also like to batch edit items in the graph view.

And an editable preview would be good. Like the gallery view, but in the graph form. This may not work for big graphs but if you’re dealing with a localized graph of tens of objects, it would be really helpful.

And I would like to be able to create objects in the graph view and link and unlink objects to each other in the graph. Basically, the graph as a mind map

I personally use graph view mostly for my daily journals and plannings to visually see how many things are related or how busy I am at that specific date .It works kind of the same way canvas does (to me & in my point of view {As i create a lot of objects and have lot’s of types and many more relations})

I love the graph view, especially coming from Notion. There, I had to search for a project and then see related items. In Anytype, following the same workflow of always assigning tasks to a project, I can simply open the graph view and visually trace what I need.

This is much quicker when I do not know the exact search terms. I can find the group that is thematically closest to what I am looking for and see where it may be.

Another use case is my daily notes, where I link to various items. I can open the graph for that note and immediately see the related projects I am working on for the day.

Some more filter options would be nice for a cleaner overview, but even in its current state, I find it useful. I also like seeing how many related items a project has, as it indicates the amount of effort I have put into it.

I clicked Yes, but with the comment that I don’t use the Graph in Anytype. I do use Graph view in Obsidian and Capacities for example.

Those Graph views have more options like filter, grouping and re-coloring based on tag or keywords. Both also have local graph in the sidebar of the note thay you have active. THIS is the most useful view in my opinion.

I know Anytype has local graph view but it is hidden behind 3 mouse clicks and never at the same time on your screen as the note you are reading/working on.

Yes! Obsidian’s local graph view shines a lot. Something like dynamic display of local graph for the focused object would be very handy in Anytype. Displaying additional levels of links/relations (e.g. 2nd / 3rd degree linkage) would also be very helpful