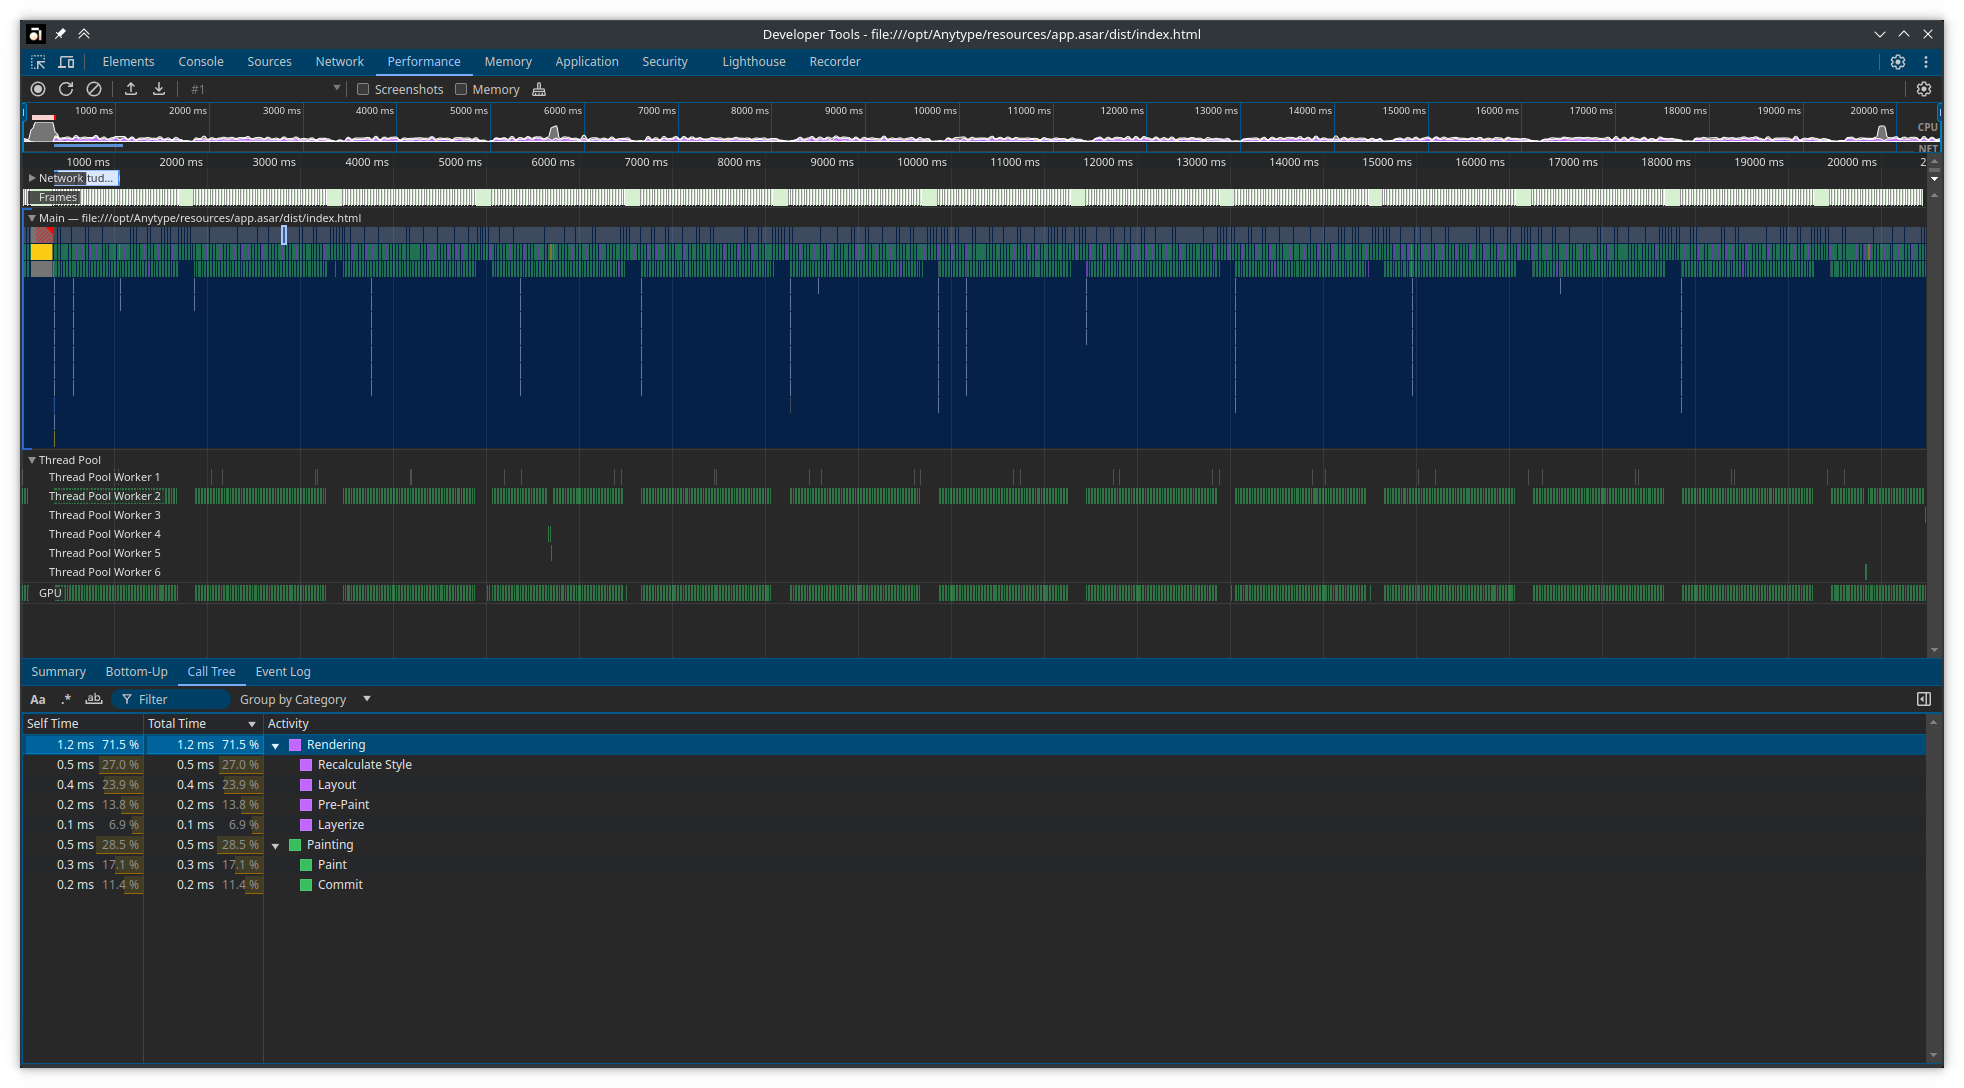
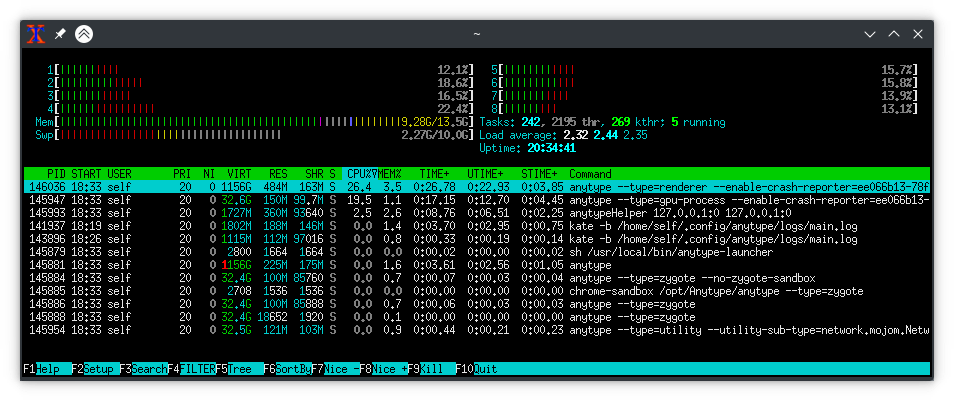
While anytype window is open (no interaction with it, no animation) on specific spaces, does not matter which object is shown, two of anytype processes constantly consume CPU time.
--type=renderer consumes about 30% of CPU core time each second --type=gpu-process consumes about 20% of CPU core time each second
I have 5 spaces with moderate amount of content (say dozens or hundreds of objects) and the bug affects 4 of them. Does not happen with almost empty spaces.
Affected both shared and private spaces.
How To Reproduce It
I do not know (
Seems that lots of objects in space increase chances of this bug affecting the space.
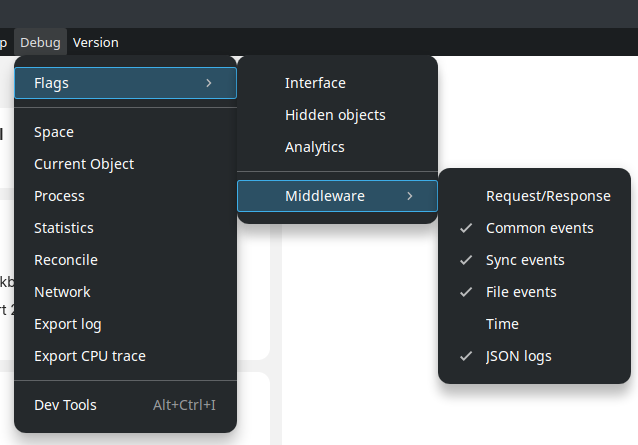
Well, hard to say anything - first of all turn on Debug → Flags → Middleware → Common events, run the app from terminal for log output and if you will notice this behavior check for both logs. I have big spaces and checked profiler in idle mode, there is nothing that behaves like this.
I tried enabling Common events debug flag and watched for Anytype stdout and tail -f ~/.config/anytype/logs/main.log.
I expected to see any log messages appearing several times per second about something that might trigger repaints. But there are no massive amounts of new log messages while Anytype is idle.
I observed this constant repaints behavior with extra CPU usage on another person’s laptop running Windows. Therefore this bug is not specific to GNU/Linux.
The strange thing is that we have 2 shared spaces with this person, let’s call them A and B.
Anytype constantly repaints while showing A space on my laptop, but does not use CPU on his.
With B space it’s the other way around: no repaints on my laptop but constant repaints on his.
Did it happen with this space before? Repaints may happen if middleware sends update events and client rerenders parts of the app. If you turn in the menu Debug -> Flags -> Middleware -> Common events and open dev tools you would see them.
This question is not clear to me. I observe this CPU usage at least several days.
I suppose you are talking about messages like “Event.BlockSetText” or “Event.ObjectDetailsAmend” that appear in Developer Tools / Consonle. There are on such new messages when Anytype is idle and renderer and gpu-process consume CPU
Some spaces that were not causing constant CPU usage by gpu-process and renderer process now hogs CPU and some previously CPU hungry spaces do not hog CPU now.
I still have this issue with desktop release 0.44.
I got tired of paying attention to always closing Anytype window to prevent laptop overheating and throttling down, so I had to devise a workaround.
By the way, that is a pretty clever workaround.
I’ll keep it in mind if I ever run into such an issue…
I am running Pop OS!, so very similar distro, however it is on a small low power PC with intel chip based, not a laptop. integrate video in the cpu, likely same as you.
I have 294 objects for the moment, so not as many as you, but adding every day. Unfortunately I do not see the issues you see.
Are you running a debian package install of AT, or something else like flatpak?
Also, is there a particular reason you did not upgrade to v0.44?
These are my versions:
OS version: linux x64 6.9.3-76060903-generic
App version: 0.44.0
Build number: build on 2024-12-16 16:53:50 +0000 UTC at #c04d64d52304c0fe8800032e74e49a7159abdbad (dirty)
Library version: v0.38.7
You could also provide the CPU trace when CPU usage is high if you update to the latest alpha.
Go to Debug → Export CPU trace, and wait for 30 seconds.
A friend of mine reported that since a couple of days his anytype desktop installation shows the same symptoms with high CPU usage by renderer and gpu-process processes.
While it could be related to this syncing issue, that seems unlikely, since CPU usage does resolve when the window is closed, and spikes again when the window is opened.
These logs do not show any significant amount of work.
I suppose you assume that unnecessary CPU usage in anytype UI is initiated by some events sent from anytypeHelper. I believe this is a wrong assumption. I can verify it by sniffing the traffic on the port where anytypeHelper listens. There are just minor amount of TCP keepalive packages flyng over the interface during idle, no meaningful interaction.
No, just JS being JS somehow do extra unneeded work. And the clue is in tracing JS execution and checking which code and why generates repaints. Have you checked trace from Developer Tools which I have attached during the initial report?
It probably does not contain enough info to shed the light on the issue but I believe should be a starting point anyway. Probably I should record the trace again enabling extra logging. I don’t know how to do that though.
And I have ensured that during interaction with anytype there is some grpc traffic. You think I have missed the proper port? Can you give me CLI command to determine from which port I need to collect traffic?