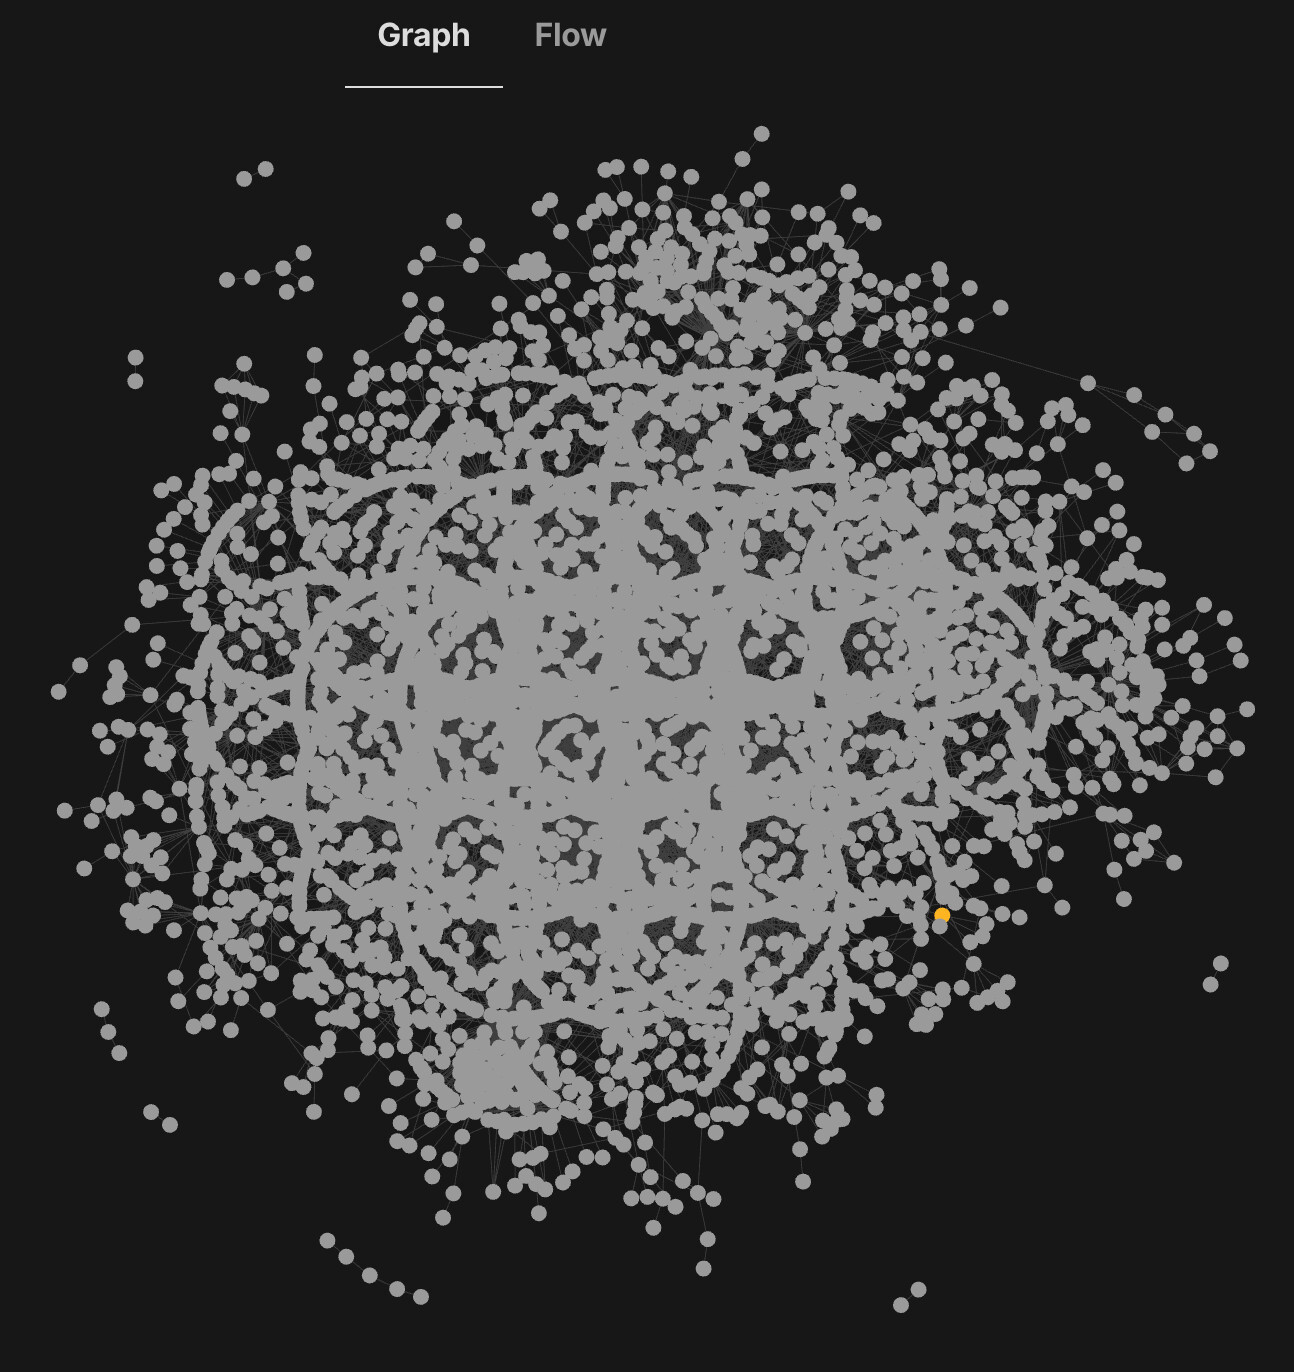
This is very necessary IMO. Also, I would add another feature to this. I don’t want my object’s icons in graph view to get smaller as I get past certain zoom level. That absoloutly makes no sense at all . I mean, what’s the point of having icons show in graph view if we can’t properly see them zoomed in?
Same, but I dont have that many objects yet. However, I think this might be the only way? Maybe they should look at obsidian where you can color code and filter it?
Good call. Obsidian currently does support more graph display options. However, I think Obsidian does something more than colour and filter. Maybe fade out or resize nodes or distance calculations? Obsidian graphs are never squeezed together regardless the number of nodes and colours
I think the most important question for you to be able to completely reduce or enlarge your graph is simple. For those who are used to using mind maps, you know that it creates drawings that are easy to identify, so when you completely reduce your view to see the entire map, you know whether to go up, down, left or right, enlarging again. the map to the place you want to go. If I can’t completely shrink the map I can’t run this efficiently. The other solution would be to have a mini map on the side (in one of the corners, usually the bottom right corner); but I think implementing a view of the entire map independent of its size is more ideal. The closer Anytype’s graphical view is to a mind map, the better it will be, and the closer it is to the graph view of Obsian, Logseq and derivatives, the worse it will be. This type of graph is more like an ornament (DO NOT CONFUSE WITH USELESS) close to the power of a mind map, because with the Mind Map I can make notes, markings, pull, push and other things that a Grafh View does not give us.
 . I mean, what’s the point of having icons show in graph view if we can’t properly see them zoomed in?